Examples
We present here three examples of the application of PSSweb to common problems of structural biology and bioinformatics. These examples involve proteins of primary biological interest. Nuclear receptor proteins and kinases are indeed implicated in various cell processes and involved in therapeutic strategies. They have been intensively studied, resulting in a large number of experimental structures.
- 1. Conformational states of CDK2
- 2. Phosphorylation of ERβ
- 3. Structural conservation of specific residues in NRs
These examples were presented in the PSS article [1].
For each example, a link to a PSS HTML report is provided.
1. Conformational states of CDK2
In this first example, PSSweb is used to analyze structural variations in an ensemble of protein structures associated to the same gene of human cyclin-dependent kinase 2 (CDK2), i.e., all structures have the same amino acid sequence up to a few point mutations or gaps. Classification of the structures into two known conformational states is assessed by cluster analysis.
Background
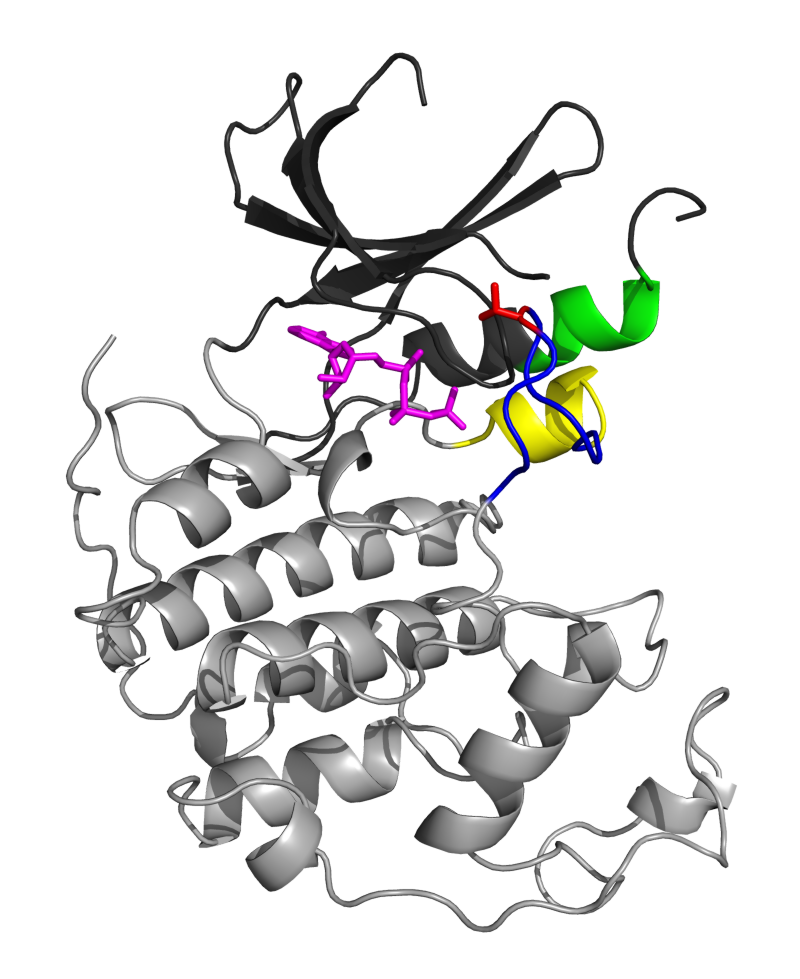
CDK2 is a member of the cyclin-dependent kinase family. It is a catalytic subunit of the cyclin-dependent kinase complex and plays an important role in the regulation of the cell cycle [2,3,4,5]. CDK2 adopts a canonical kinase fold (see Figure 1A), comprised of two lobes separated by a hinge region that forms a cleft. The ATP binding site is located within this cleft [6]. The target protein is known to bind to the larger carboxy-terminal lobe, close to the cleft. The activation of CDK2 requires the binding of cyclin, as well as the phosphorylation of a conserved threonine residue (Thr160) located in the activation loop, which is also referred as the T-loop [7]. Upon cyclin binding, important conformational changes occur that include the conversion of the L12 helix preceding the T-loop to a β strand. This, in turn, induces a rearrangement of the T-loop that opens access to the catalytic site. Another change involves the reorientation of the α helix containing a conserved PSTAIRE sequence, leading to an optimal positioning of key amino acids in the active site [8]. CDK2 is an interesting system to illustrate structural variations of a protein because of the existence of two well-defined inactive and active states and the large amount of structural information available.
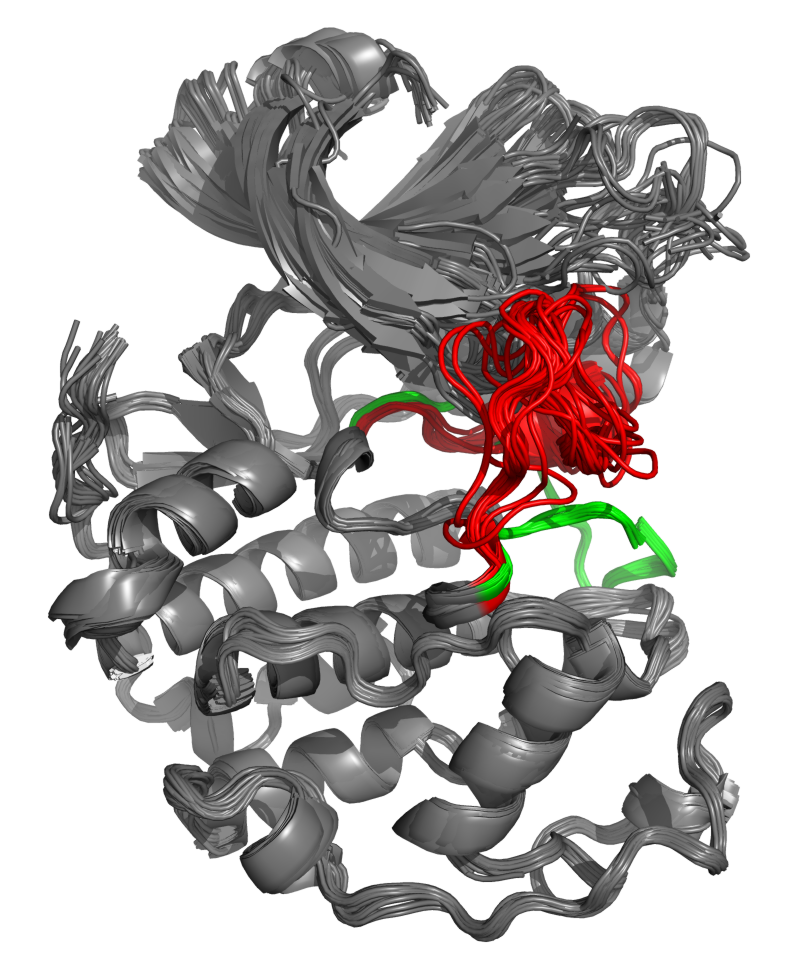
Figure 1: CDK2 structural elements and superposition. A. The small amino-terminal lobe of CDK2 (1HCK:A) is colored in dark gray, while the large carboxy-terminal lobe is in light gray. The L12 helix is shown in yellow, the T-loop in blue, the Thr160 sidechain in red, and the PSTAIRE motif in green. The ATP ligand is pictured as magenta sticks. B. Superposition of CDK2 structures on 1HCK:A. The L12 helix and T-loop region of major conformational change between inactive and active states is highlighted in red for the inactive state, and green for the active state.
| A | B |
|---|---|
 |
 |
Selection of structures
A list of 217 human CDK2 structures was retrieved from the P24941 UniProt entry. After exclusion of theoretical models and structures with a resolution above 2.0 Å, the list was reduced to 95 PDB entries. When multiple CDK2 chains were available in a PDB structure, each one was considered separately, yielding a structure list of 104 PDB chains. A reduced structure list of 64 entries was prepared, where chains with missing residues in the L12 helix and T-loop region (residues 144–166) were excluded. These two regions are implicated in the characteristic conformational changes occurring upon CDK2 activation. Each CDK2 chain was labelled as belonging to the families active (18 chains) or inactive (46 chains), based on the presence or not of a cyclin or CDK inhibitor partner in the structure.
Alignment and superposition
In this example, all structures are essentially derived
from the same gene, their sequences differ only by the delimitation
of extremities, the presence of gaps where the structure could not be
solved, and some point mutations or engineered positions. These small
variations in sequence are handled automatically by PSSweb and the multiple
sequence alignment can be straightforwardly derived from PDB numbering
with the PDB numbering
alignment method. Structures were then superposed on
the A chain of 1HCK, which is the ATP-bound inactive structure
with the best resolution (1.9 Å) among selected structures.
Superposed structures of CDK2 can be seen in
Figure 1B.
Structural fluctuations
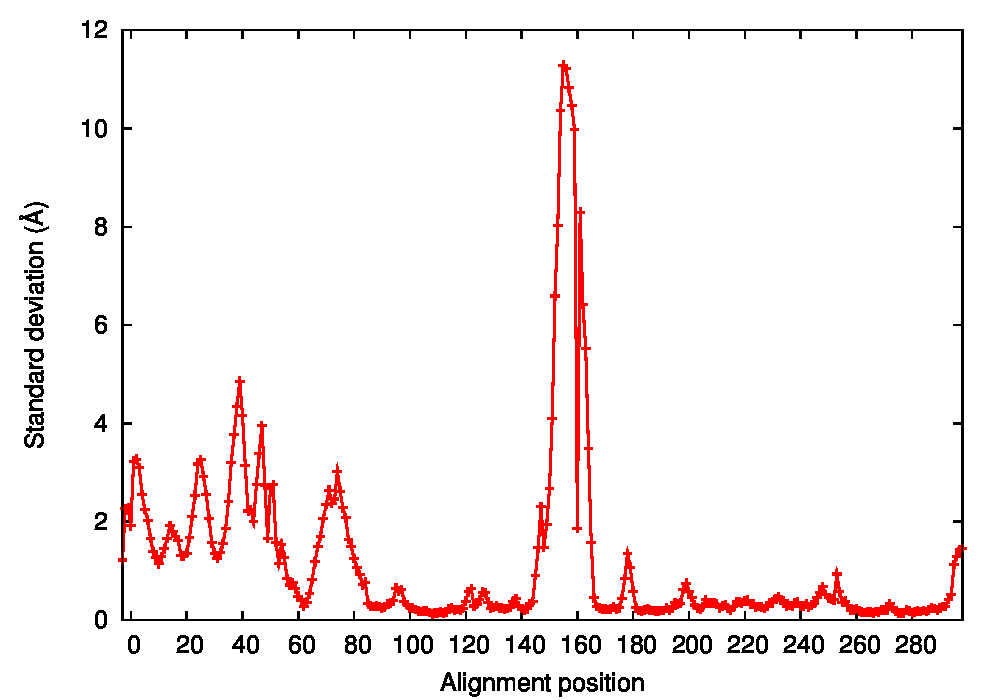
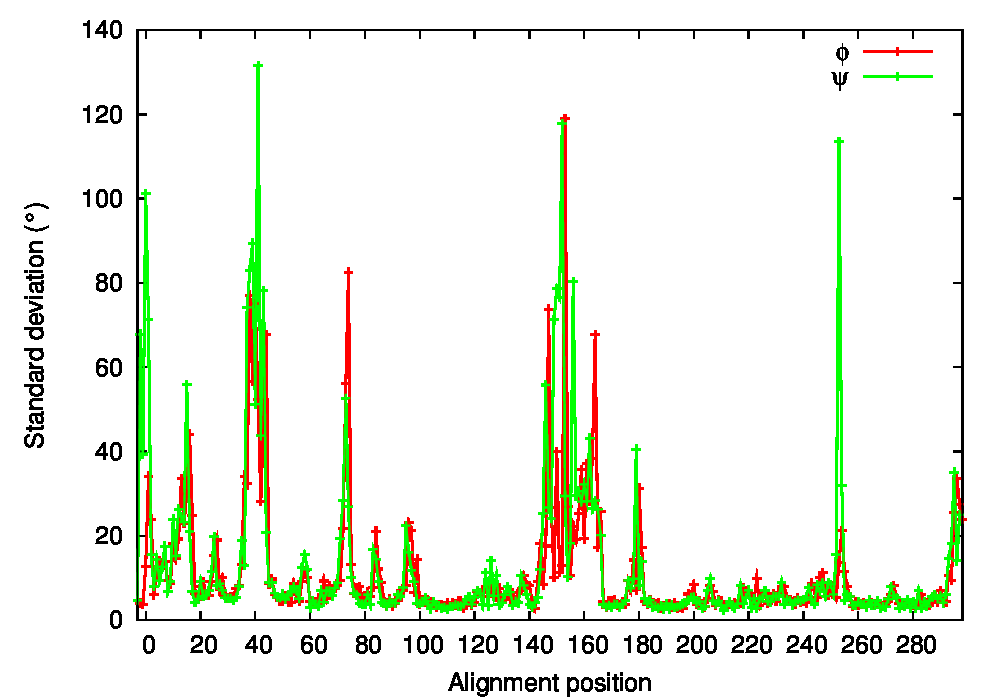
Structural fluctuations by alignment position were then calculated with PSS, both in Cartesian (average standard deviation of backbone coordinates, Figure 2A) and dihedral coordinates (average standard deviation of φ and ψ angles, Figure 2B). This allows an overall characterization of structural variations in the CDK2 protein dataset. Both analyses reveal that the most flexible region of the protein backbone is the 144–166 residue range. Residues 147–153 correspond to the L12 helix, present in the inactive state and known to lose its helical structure in the active state. Residues 154–164 correspond to the T-loop, known to undergo an important conformational change accompanying cyclin binding and Thr160 phosphorylation in the active state. Other significantly variable regions include residues 13–16 of the Gly-rich loop, residues 22–28 of a loop between the strands following the Gly-rich loop, residues 36–44 corresponding to the loop preceding the PSTAIRE helix, and residues 68–77 of a loop between the strands following the PSTAIRE helix. The PSTAIRE motif itself appears in Cartesian but not in dihedral fluctuations, which is indicative of a rigid body displacement.
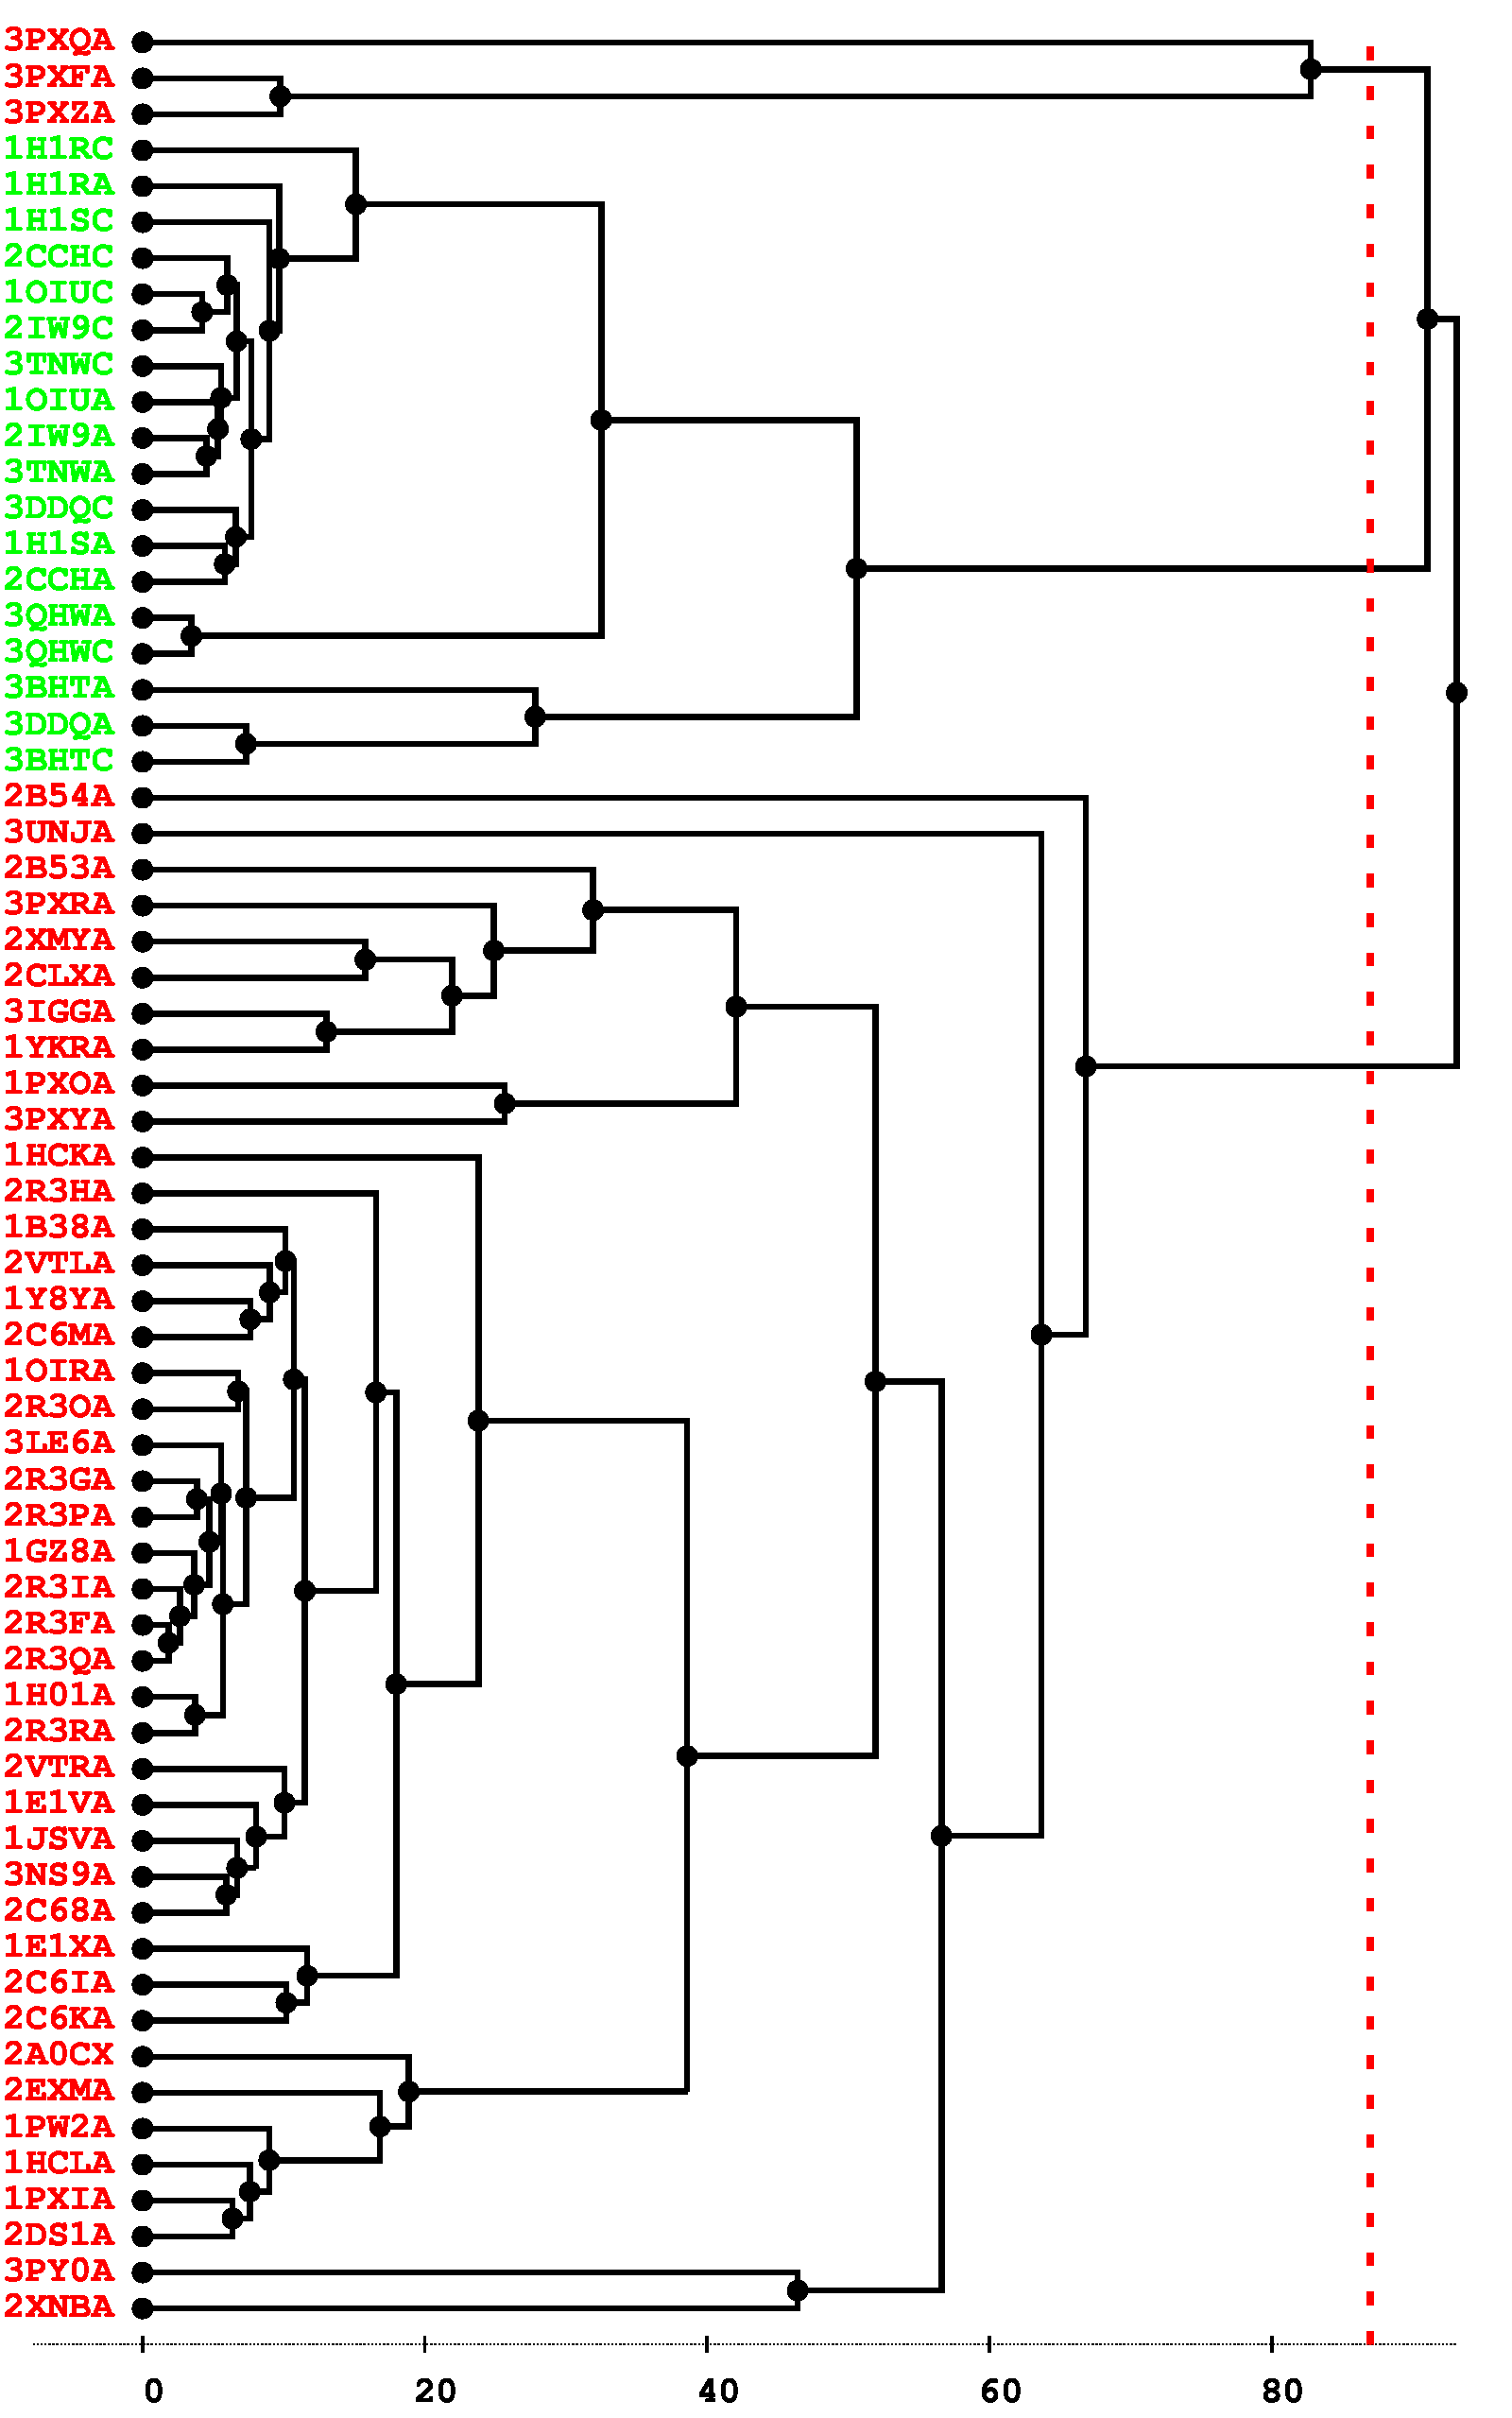
Figure 2: Conformational states of CDK2. A. Standard deviation of backbone coordinates of CDK2 structures by residue. B. Standard deviation of φ and ψ angles of CDK2 structures by residue. C. Cluster analysis of CDK2 structures. The tree is obtained from hierarchical clustering with the maximum-linkage method. Variables taken into account are the φ and ψ angles of the L12 helix and T-loop region (residues 144–166). Inactive and active structure PDB codes are respectively written in red and green.
| A | C |
|---|---|
 |
 |
| B | |
 |
Clustering
The CDK2 structures were then submitted to a cluster analysis. We expect to be able to identify two clusters, corresponding to the inactive and active conformational states. Variables taken into account in the clustering were defined in the position list file, as the φ and ψ dihedral angles of the L12 helix and T-loop region (residues 144–166). This region is indeed known to be a marker of the difference between inactive and active states, and was shown above to be the region with the most important backbone fluctuations in CDK2 structures. Hierarchical clustering was performed using the maximum-linkage method. The clustering tree obtained can be seen in Figure 2C. All active structures and most inactive structures were placed in well separated clusters. Three inactive structures (3PXQ:A, 3PXF:A, and 3PXZ:A) unexpectedly appeared in a third cluster, closer to active structures. Examination of these structures revealed that they contain ligands bound to a site other than the ATP binding site, causing a displacement of PSTAIRE and L12 helices, as well as an important deformation of the T-loop. Aside from these three unusual structures, two well separated clusters can be robustly identified from the tree, using a cutting radius ranging from about 70 to 90°. These two clusters correspond exactly to the inactive and active conformational states. The clustering results also show that there is more structural diversity in the inactive than in the active state. This could be explained by the presence of the cyclin partner of CDK2 in the active state, which has an ordering effect on the T-loop located at the binding interface.
Conclusion
In summary, PSSweb allowed us to characterize the most structurally variable regions of CDK2. A cluster analysis focusing on these elements was able to map the structures into clusters that exactly match the inactive and active states of the protein. Additionally, this analysis allowed us to identify atypical structures, whose particularity could have been missed in a visual inspection of a large number of structures.
2. Phosphorylation of ERβ
In this second example, PSSweb is used to probe the structural effects of a punctual modification, the phosphorylation of the estrogen receptor β (ERβ). Differences between wild-type and phosphorylated structures are first examined, and, then, the significance of these preliminary observations is evaluated by considering a larger set of structures.
wildtype vs phosphorylated report
more wildtypes vs phosporylated report
Background
Nuclear receptors are multi-domain ligand-dependent transcription factors that control gene activation. The transcriptional activity of these receptors is also subjected to another level of control through post-translational modifications, such as phosphorylation. The estrogen receptor is part of this family of receptors and exists as two subtypes, ERα and ERβ. Experimental studies have shown that phosphorylation of the ERβ estrogen receptor at Tyr488 controls its assembly with the Src kinase [9,10]. More generally, phosphorylation of ERs is known to be important for its localization in the nucleus [11]. The first structure of a phosphorylated nuclear receptor was published in 2010, that of the estrogen receptor ERβ phosphorylated at tyrosine residue 488 (3OLL), issued together with its wildtype counterpart (3OLS) [12]. Structural biology approaches have provided essential information on the molecular mechanism of NR activation by hormones through the determination of a multitude of structures. However, the structural effects linked to ER phosphorylation and its molecular signalling pathways are still not well understood. In the case of WT and phosphorylated ERβ, the backbone RMSD between the two structures is small (0.47 Å) and no significant differences were noted by the authors when comparing both structures [12].
PSSweb application
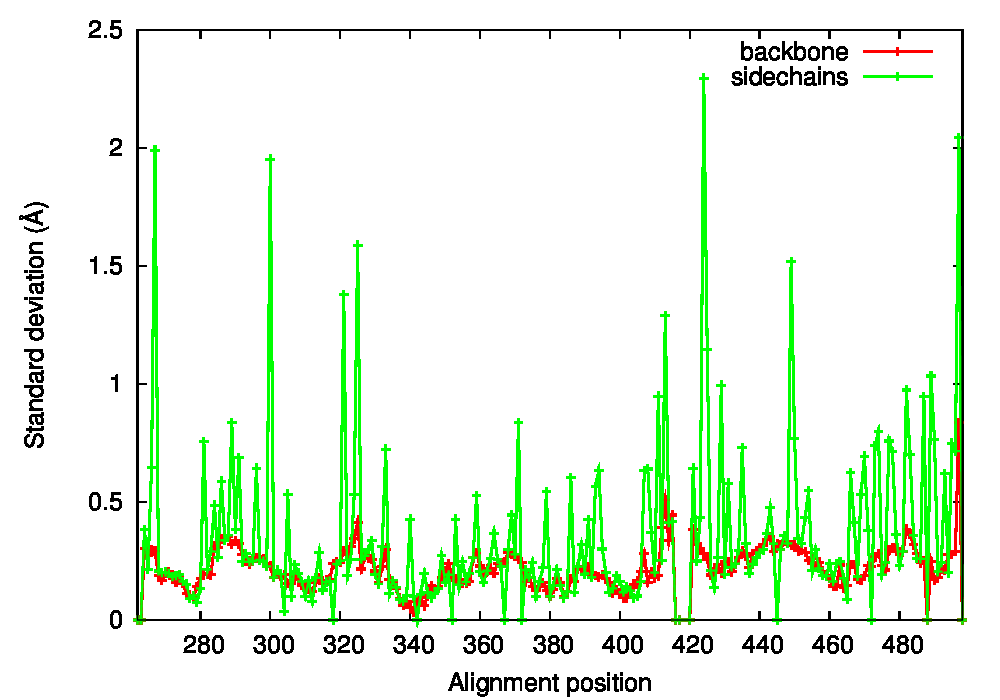
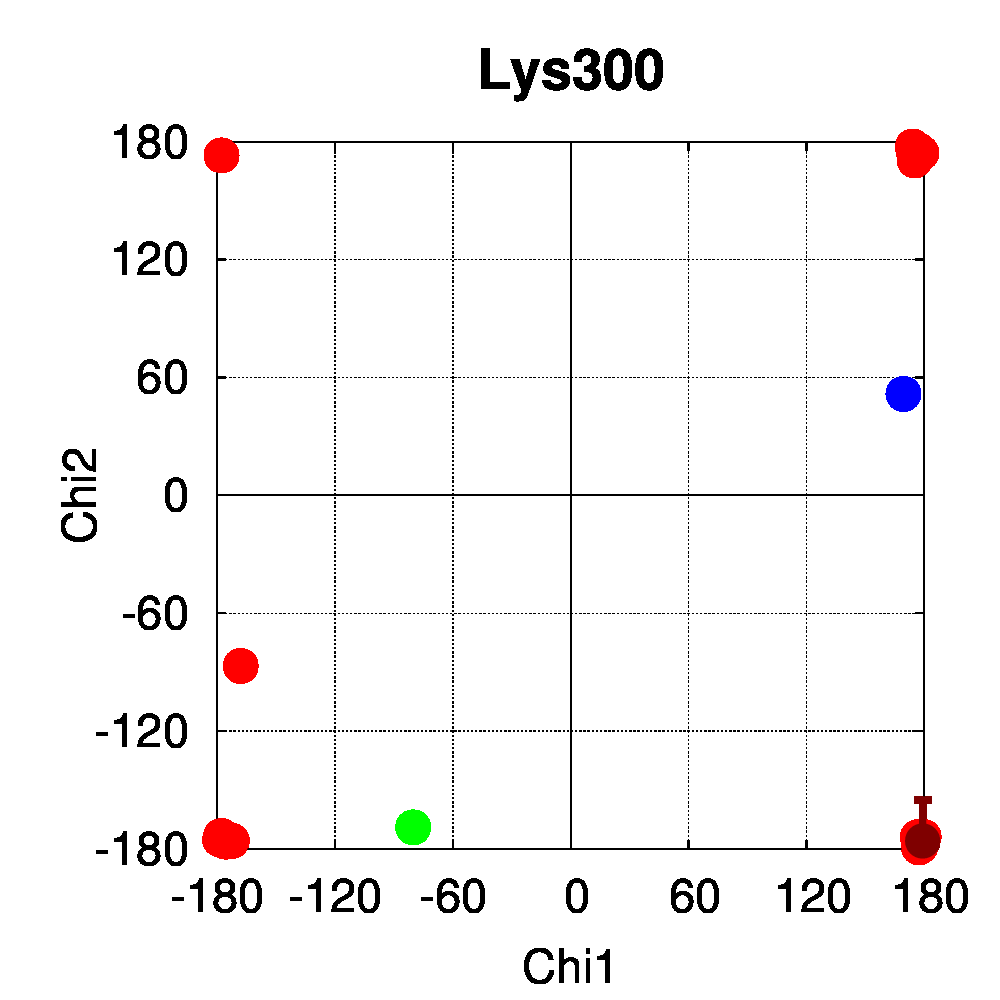
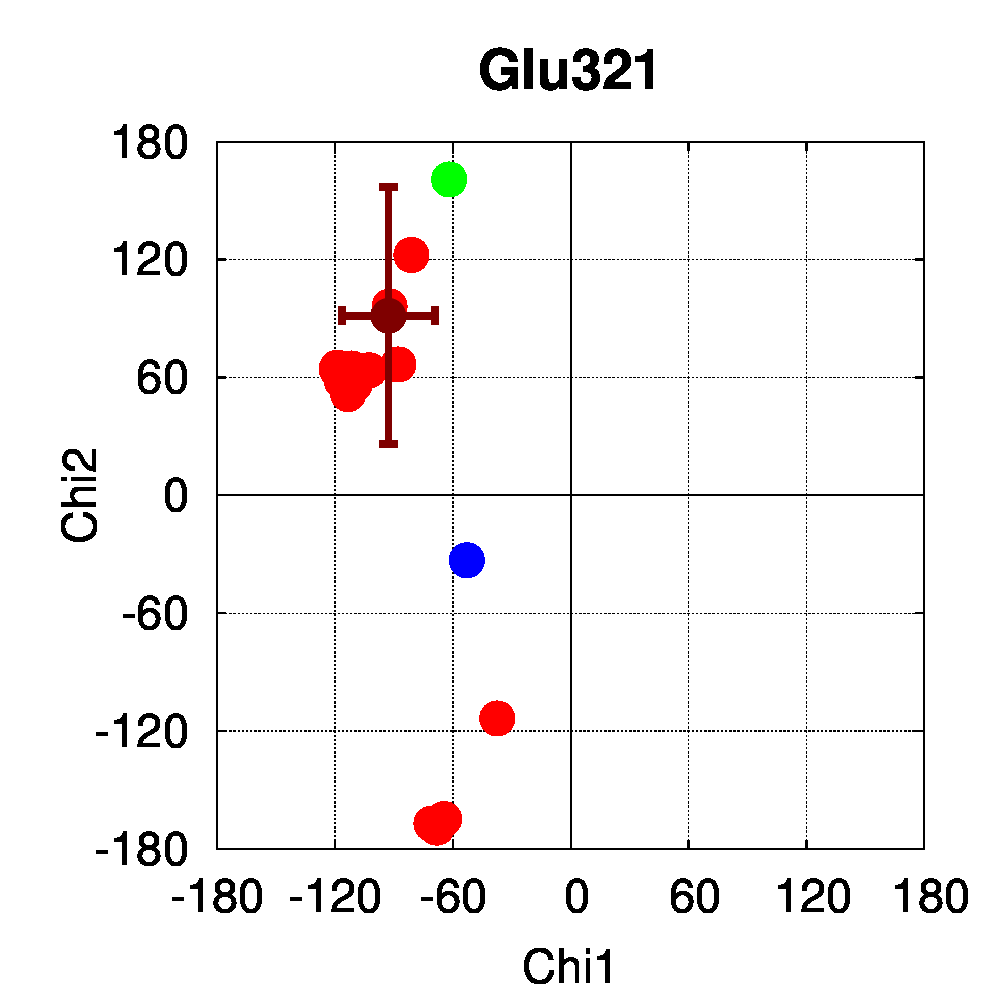
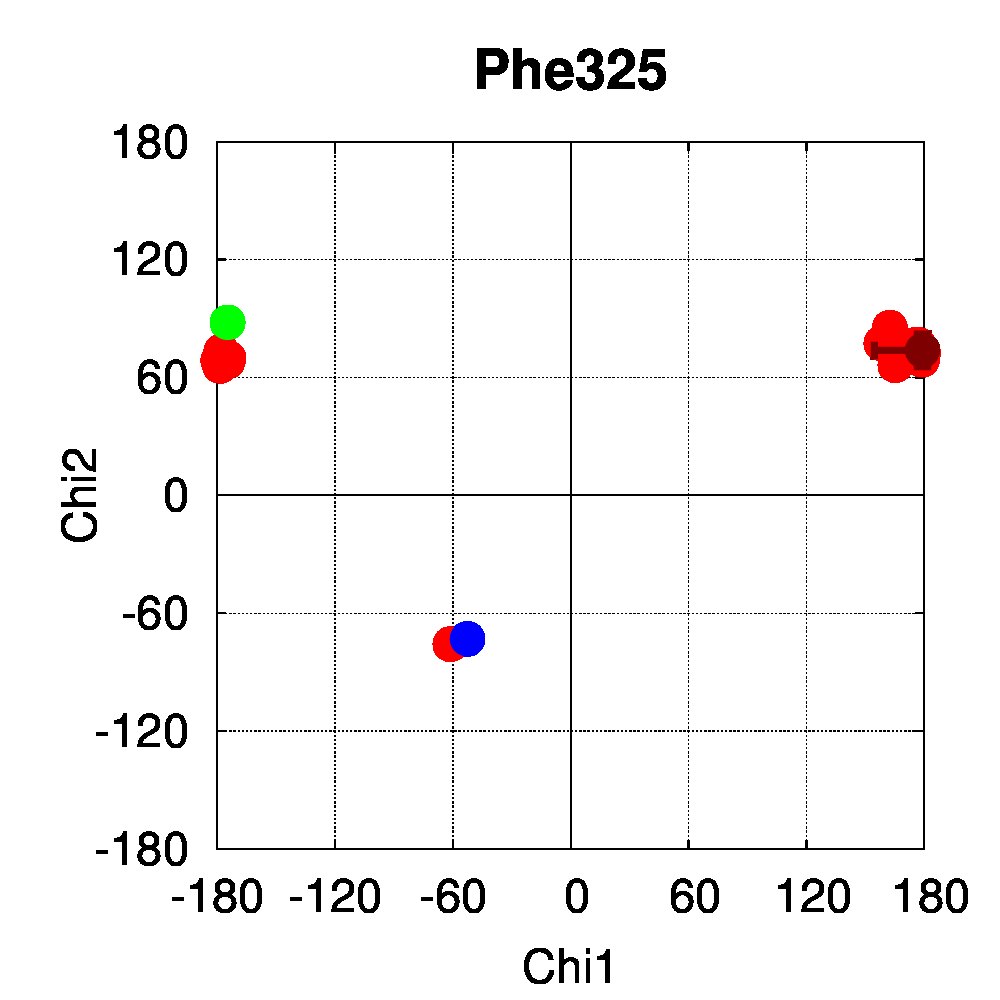
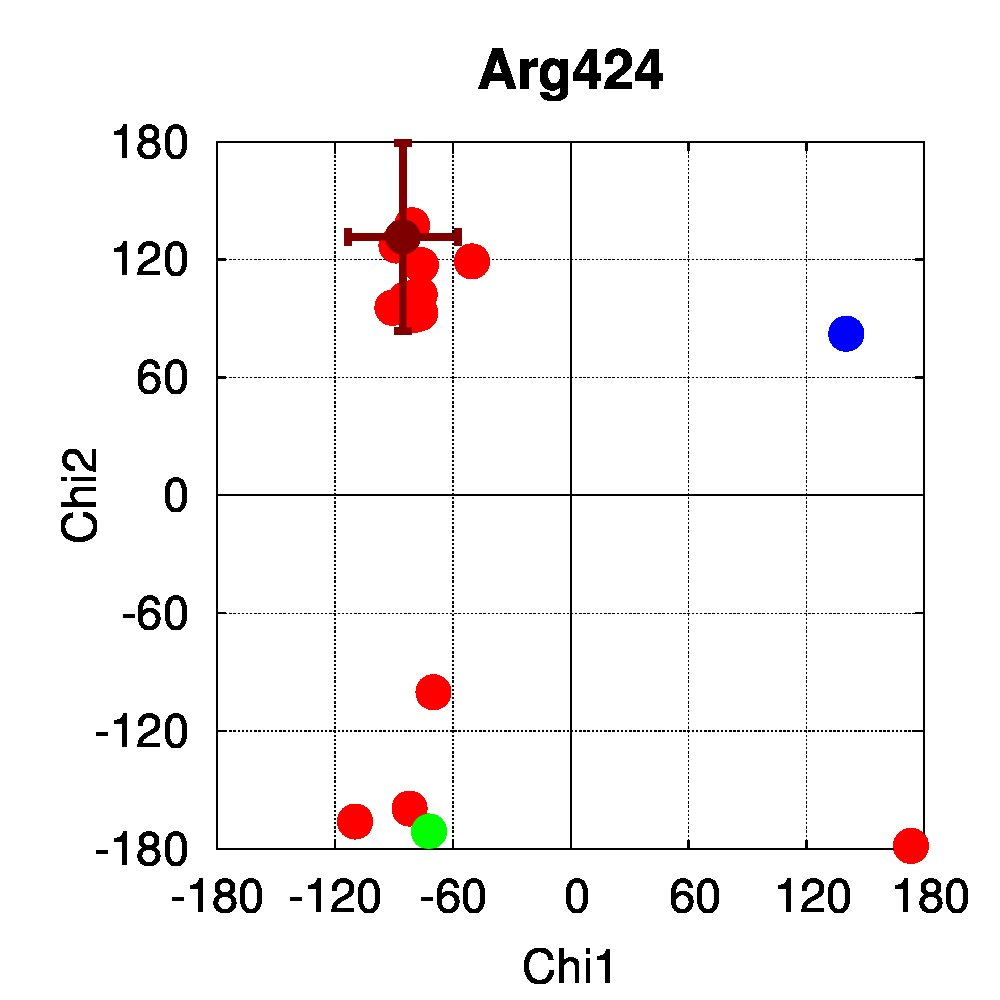
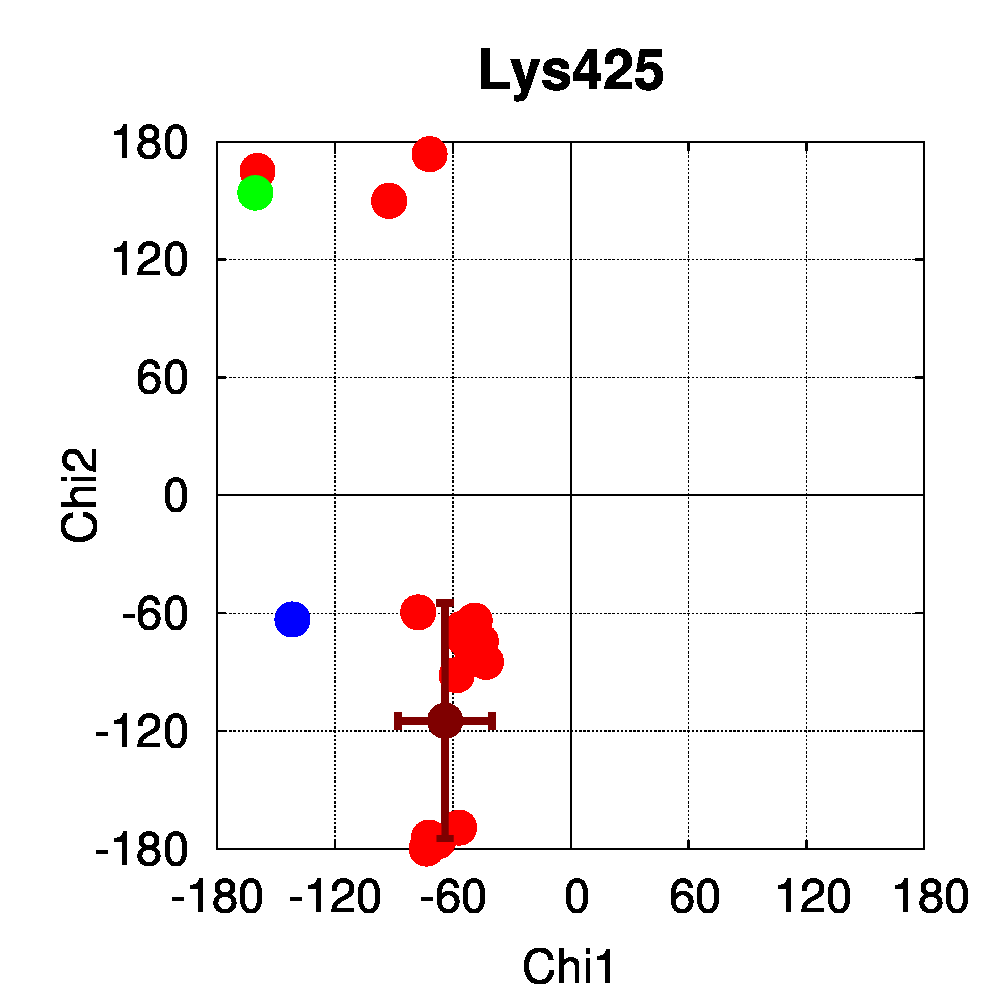
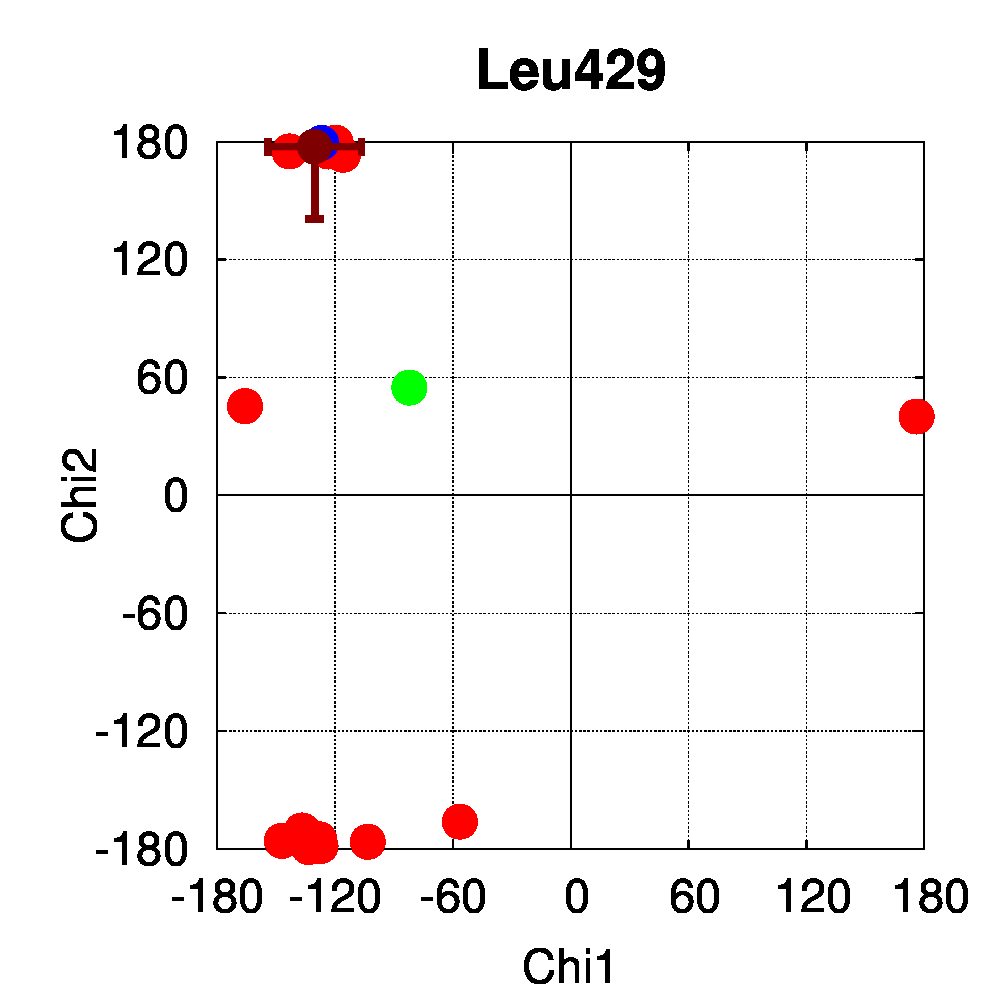
We used PSSweb to obtain a thorough comparison and systematically identify all structural differences between the phospho-receptor (3OLL) and WT (3OLS) that could be related to functional changes. Structural differences averaged by residue (Figure 3A) reveal that, although only limited changes can be observed in the receptor backbone, some residues exhibit larger differences in their sidechains, namely Lys300, Glu321, Phe325, Arg424, Lys425, and Leu429. This allows us to ask the question if these changes in side chain orientations are correlated with phosphorylation. In order to address this question, we performed a second PSSweb analysis, completing our dataset with 19 additional structures of the ERβ wild-type form extracted from the PDB. χ1/χ2 dihedral angles (see Figure 3B) were examined for the residues previously identified as having notable sidechain differences between wild-type and phosphorylated forms. This analysis revealed that the intrinsic variability of the sidechain conformation of these residues in the additional wild-type structures (red) is of similar order as the difference observed between the single structures of wild-type (blue) and phosphorylated (green) forms. One cannot therefore link the side-chain rearrangements observed in the phosphorylated structure (3OLL) as characteristically adopted upon phosphorylation.
Figure 3: Phosphorylation of ERβ. A. Backbone (red) and side chain (green) coordinate differences by residue between the phosphorylated (3OLL) and wild-type (3OLS) ERβ structures. B. χ1/χ2 dihedral angle distributions for selected side chains of ERβ structures. The green point correspond to the phosphorylated structure (3OLL) and the blue point to the wild-type structure (3OLS). Red points correspond to 19 additional wild-type structures, and the dark red point and bars show their average angle values and standard deviations.
| A | ||
|---|---|---|
 |
||
| B | ||
 |
 |
 |
| C | ||
 |
 |
 |
Conclusion
In this example, PSSweb allowed us to easily perform a detailed comparison of the phosphorylated and wild-type forms of ERβ. We were able to easily identify localized structural differences, and to assess their significance by comparison to a larger set of WT structures.
3. Structural conservation of specific residues in NRs
In this last example, PSSweb is used to compare two homolog families of nuclear receptors (NR). Sequence conservation of specific positions among nuclear receptor classes is known and we evaluate the structural conservation of the corresponding residues.
Background
Besides being regulated by ligand binding and phosphorylation, nuclear receptors proteins bind to and are regulated by a variety of other co-regulator proteins. An essential aspect is that most NRs are active as dimers. NRs are classified into class I and class II receptors, depending on their ability to respectively form homo- or heterodimers. This distinction has been shown to be present at the sequence level through conservation of specific residues in both classes [13]. In particular, highly conserved salt bridges, that are specific to either homo- or heterodimeric receptors, have been identified [13] and the functional importance of these salt bridges has been experimentally demonstrated [14]. Using PSS, we can explore whether this specific sequence conservation is also observed at the level of structure, that is, if residues that are highly conserved in sequence have conserved conformations in an ensemble of structures of different nuclear receptors.
PSSweb application
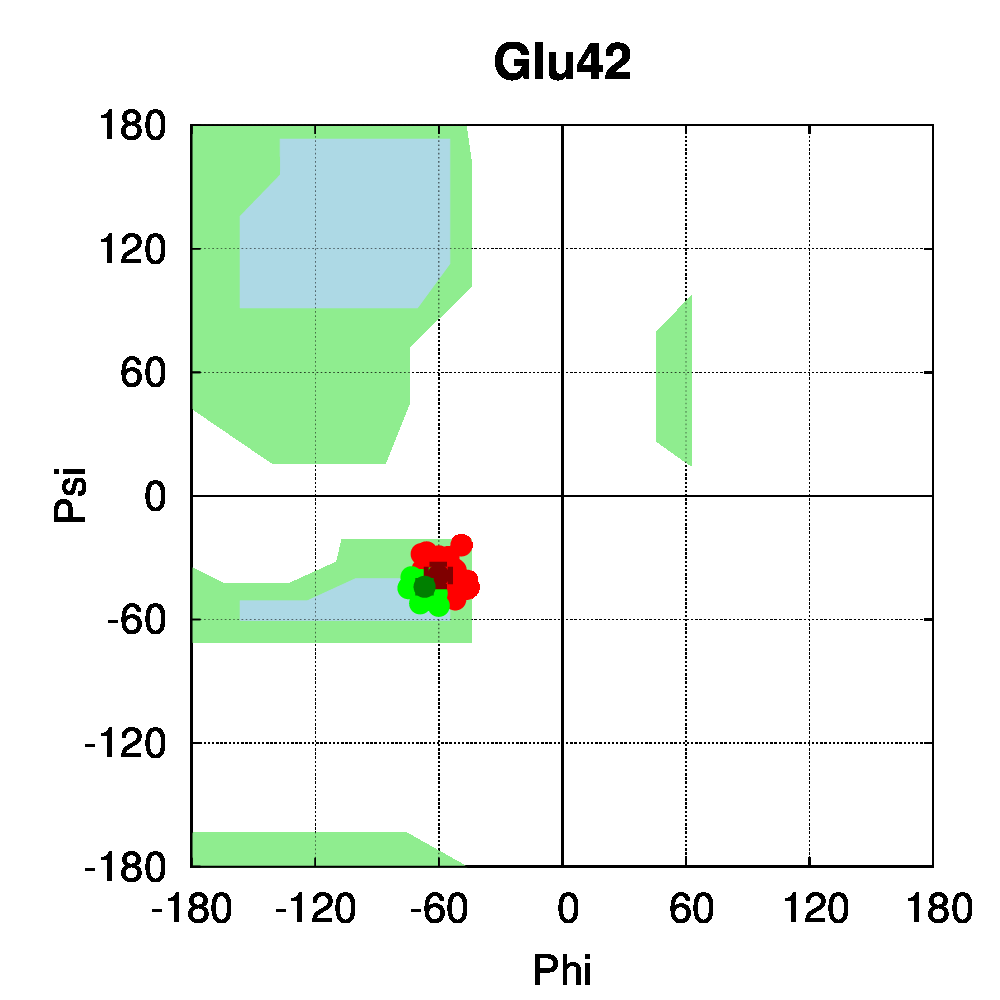
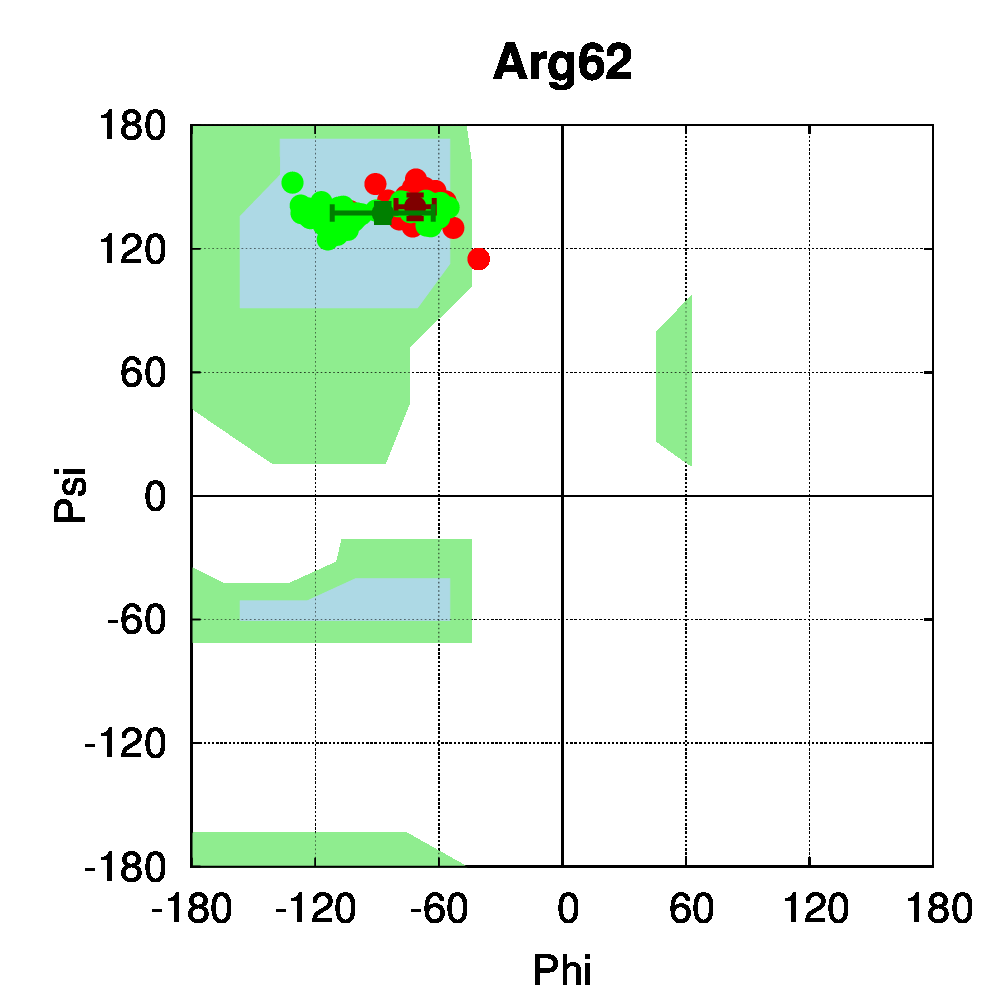
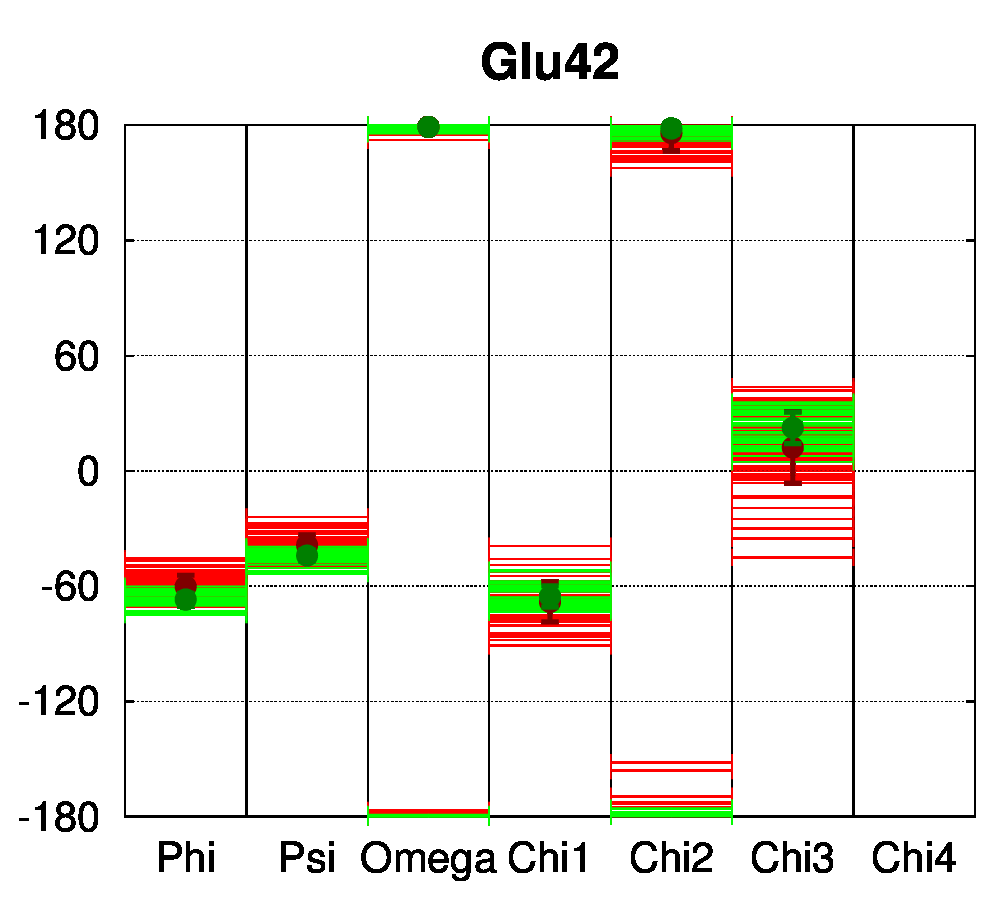
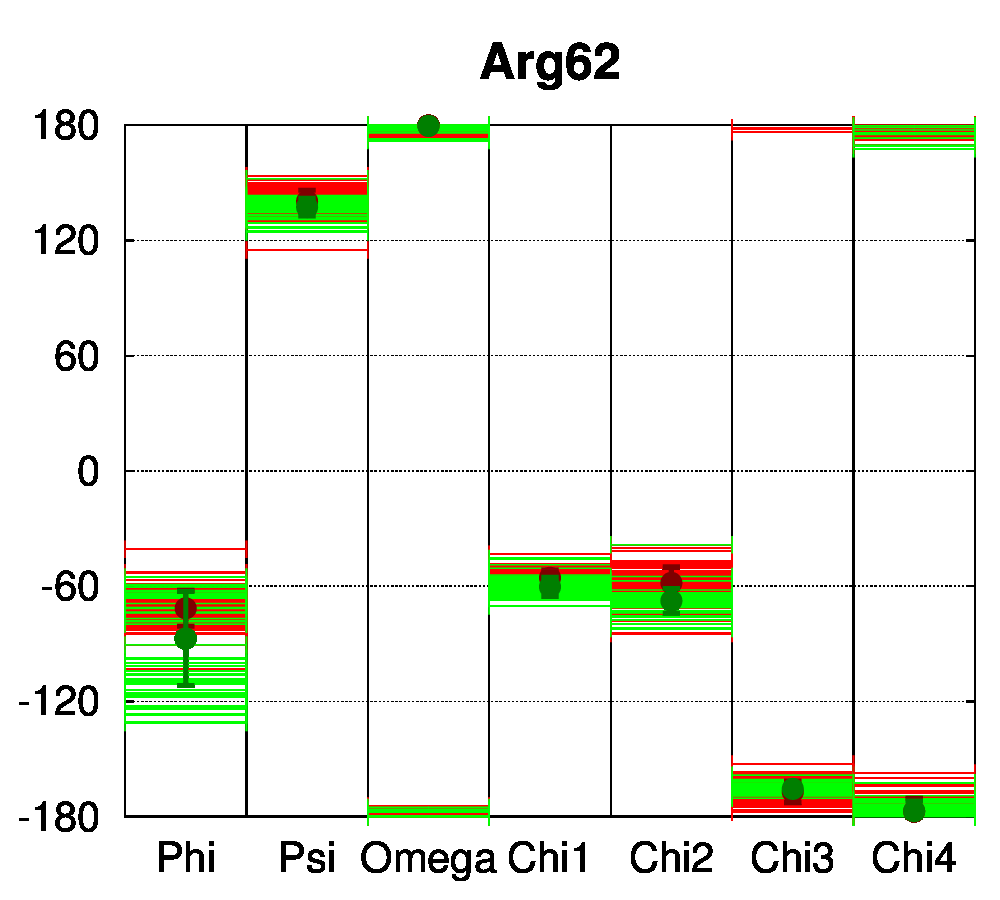
To be able to assess the statistical relevance of the observations made in this study, class II nuclear receptors with a sufficient number of available structures were selected. Our dataset comprised 112 class II receptor structures: 62 structures of the peroxisome proliferator-activated receptor (PPAR) and 50 structures of the vitamin D receptor (VDR). In heterodimeric receptors (class II), a salt bridge was shown to be conserved [13] between negatively (mostly Glu) and positively charged (mostly Arg) residues, connecting two helices of the ligand binding domain. Dihedral angle distributions were computed with PSSweb for the 112 receptors structures. The backbone dihedral angles of the salt bridge residues conserved in sequence, Glu42 and Arg62 (numbering follows the sequence alignment of Brelivet et al. [13]), are conserved in PPAR and VDR structures studied (Figure 4A). The sidechain torsion angles (χ1, χ2, χ3, and χ4) are also remarkably conserved (Figure 4B). It must be noted that conservation of sidechain dihedral angles is not systematic, in particular for sidechains with the most degrees of freedom. Arg is the most flexible residue (along with Lys) with the highest number of degrees of freedom. A large number of energetically accessible rotamers have been identified for Arg and observed in databases of protein structures (for example, 34 rotamers are defined for Arg by Lovell et al. [15]). Glu has a more restricted conformational space, but distinct rotamers have also been observed (8 rotamers according to Lovell et al.).
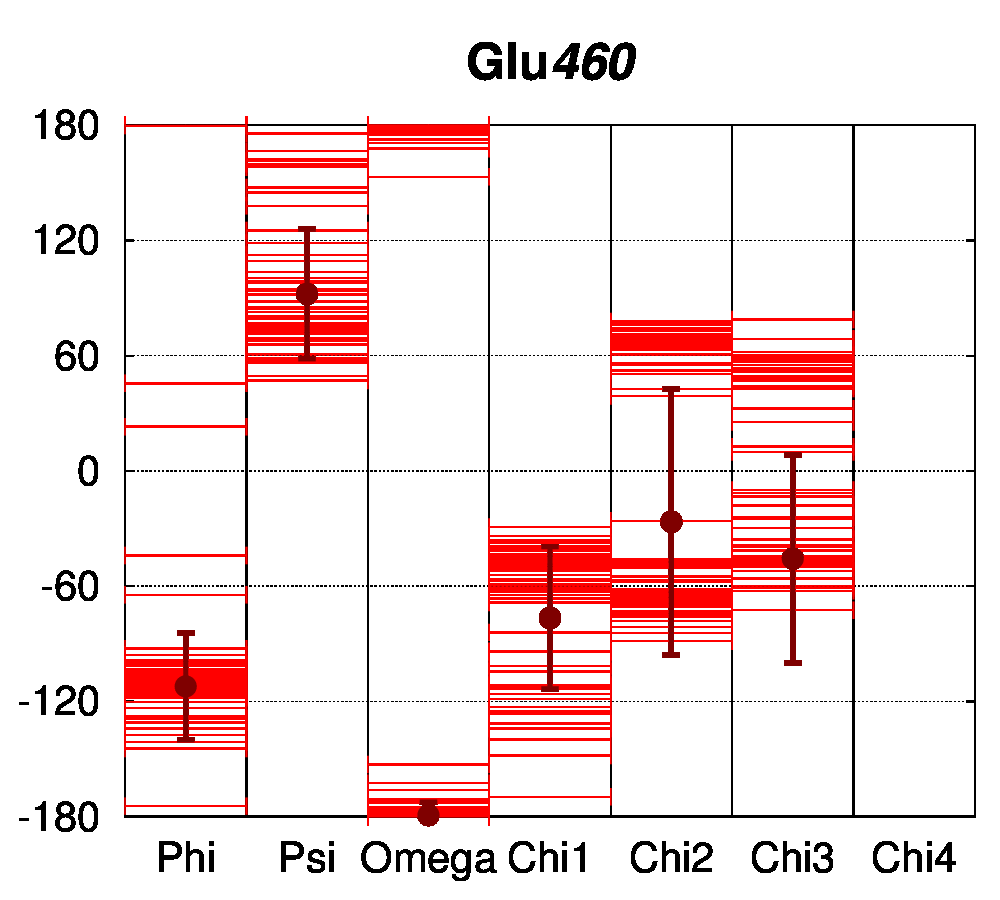
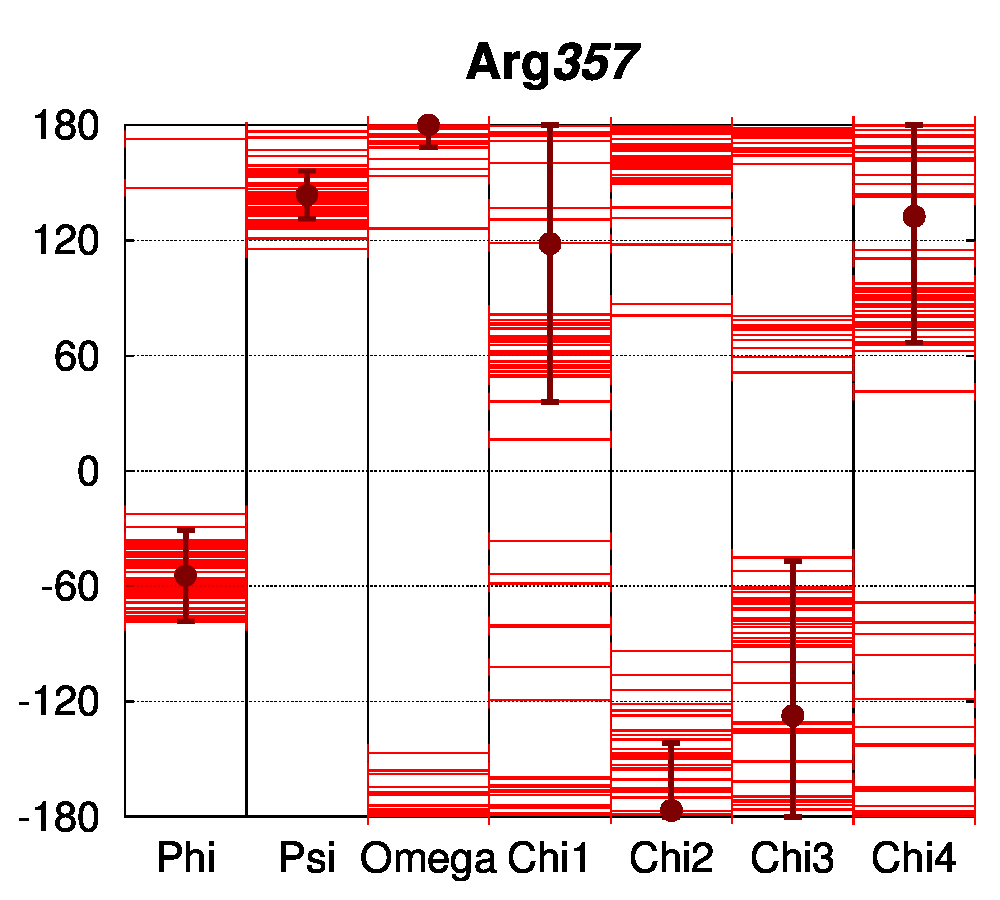
For the conserved Arg62 of the PPAR and VDR receptors, the standard deviation of χ1 is remarkably low (4.5°, while it is of 25.1° for all Arg residues of the structures). The same comparison can be made for Glu42, where the average standard deviation of χ1 is of 8.0°, while it is of 34.6° for all Glu residues in the structures. For further comparison, the dihedral angles of a salt bridge observed in PPAR structures between residues Glu460 and Arg357 (PDB numbering of 1PRG), but not conserved in other nuclear receptors, have been examined (Figure 4C). The sidechain conformation of these residues is much more variable than for Glu42 and Arg62. The observation that the class-conserved salt bridge Glu42–Arg62 has a narrow distribution of rotameric states thus shows that the sequence conservation is correlated to structural conservation through different receptors.
Figure 4: Structural conservation of specific residues in NRs. A. Ramachandran plots for Glu42 and Arg62 conserved residues (numbering follow the sequence alignment of Brelivet et al. [13]) of PPAR (red) and VDR (green) nuclear receptor structures. B. Dihedral stripe plots for Glu42 and Arg62 residues of PPAR (red) and VDR (green) structures. C. Dihedral stripe plots for Glu460 and Arg357 residues (PDB numbering of 1PRG) of PPAR structures.
| A | |
|---|---|
 |
 |
| B | |
 |
 |
| C | |
 |
 |
Conclusion
In this example, PSSweb allowed us to study local conformational preference of amino acids and to highlight sequence-structure relationships in a large number of nuclear receptor ligand binding domains. The analysis showed that sequence conservation was complemented by structural conservation of sidechain rotamers, even for flexible amino acids like arginines.
References
[1]
Protein structural statistics with PSS.
T. Gaillard, B. B. L. Schwarz, Y. Chebaro, R. H. Stote, A. Dejaegere
J. Chem. Inf. Model. 2013, 53, 2471-2482.
doi:10.1021/ci400233j
[2]
Animal Cell Cycles and Their Control.
C. Norbury, P. Nurse
Annu. Rev. Biochem. 1992, 61, 441-470.
[3]
Cyclins and their associated cyclin-dependent kinases in the human cell cycle.
J. Pines
Biochem. Soc. Trans. 1993, 21, 921-925.
[4]
Evidence that the G1-S and G2-M transitions are controlled by different cdc2 proteins in higher eukaryotes.
F. Fang, J. W. Newport
Cell 1991, 66, 731-742.
[5]
Regulation of the Cell Cycle by the cdk2 Protein Kinase in Cultured Human Fibroblasts.
M. Pagano, R. Pepperkok, J. Lukas, V. Baldin, W. Ansorge, J. Bartek, G. Draetta
J. Cell Biol. 1993, 121, 101-111.
[6]
Crystal structure of cyclin-dependent kinase 2.
H. L. De Bondt, J. Rosenblatt, J. Jancarik, H. D. Jones, D. O. Morgan, S.-H. Kim
Nature 1993, 363, 595-602.
[7]
A novel cyclin associates with M015/CDK7 to form the CDK-activating kinase.
R. P. Fisher, D. O. Morgan
Cell 1994, 78, 713-724.
[8]
Mechanism of CDK activation revealed by the structure of a cyclinA-CDK2 complex.
P. D. Jeffrey, A. A. Russo, K. Polyak, E. Gibbs, J. Hurwitz, J. Massagué, N. P. Pavletich
Nature 1995, 376, 313-320.
[9]
Sex-steroid hormones and EGF signalling in breast and prostate cancer cells: Targeting the association of Src with steroid receptors.
F. Auricchio, A. Migliaccio, G. Castoria
Steroids 2008, 73, 880-884.
[10]
Steroid-induced androgen receptor-oestradiol receptor beta-Src complex triggers prostate cancer cell proliferation.
A. Migliaccio, G. Castoria, M. Di Domenico, A. de Falco, A. Bilancio, M. Lombardi, M. V. Barone, D. Ametrano, M. S. Zannini, C. Abbondanza, F. Auricchio
EMBO J. 2000, 19, 5406-5417.
[11]
Tyrosine phosphorylation of estradiol receptor by Src regulates its hormone-dependent nuclear export and cell cycle progression in breast cancer cells.
G. Castoria, P. Giovannelli, M. Lombardi, C. De Rosa, T. Giraldi, A. de Falco, M. V. Barone, C. Abbondanza, A. Migliaccio, F. Auricchio
Oncogene 2012, 31, 4868-4877.
[12]
Synthesis and Crystal Structure of a Phosphorylated Estrogen Receptor Ligand Binding Domain.
S. Möcklinghoff, R. Rose, M. Carraz, A. Visser, C. Ottmann, L. Brunsveld
ChemBioChem 2010, 11, 2251-2254.
[13]
Signature of the oligomeric behaviour of nuclear receptors at the sequence and structural level.
Y. Brelivet, S. Kammerer, N. Rochel, O. Poch, D. Moras
EMBO Rep. 2004, 5, 423-429.
[14]
Phosphorylation by PKA potentiates retinoic acid receptor alpha activity by means of increasing interaction with and phosphorylation by cyclin H/cdk7.
E. Gaillard, N. Bruck, Y. Brelivet, G. Bour, S. Lalevée, A. Bauer, O. Poch, D. Moras, C. Rochette-Egly
Proc. Natl. Acad. Sci. U. S. A. 2006, 103, 9548-9553.
[15]
The Penultimate Rotamer Library.
S. C. Lovell, J. M. Word, J. S. Richardson, D. C. Richardson
Proteins 2000, 40, 389-408.
