Help
PSSweb takes as input an ensemble of PDB files of protein structures. It performs a multiple sequence alignment, and computes structural statistics for each position of the alignment. Different optional functionalities are proposed: structure superposition, Cartesian coordinate statistics, dihedral angle calculation and statistics, and a cluster analysis based on dihedral angles. An interactive HTML report is generated, containing a summary of the results, tables, figures, and 3D visualization of superposed structures.
The Input form of PSSweb is first described, with an explanation for each option available. The content of the Results page is then presented. At last, the Testcase available with the "Load example" button of the input form is detailed.
A detailed description of the inner functioning of PSS, the stand-alone program behind PSSweb, is available from the PSS web page: [http://thomasgaillard.fr/pss].
Input form
Input data for PSSweb consists in a set of PDB files of protein structures. The first and mandatory steps in a PSSweb analysis consist in reading the structures and sequences, and determining a multiple sequence alignment as well as a consensus sequence. The subsequent optional analyses include structure superposition, Cartesian statistics, dihedral calculation and statistics, and clustering.
Structure list
A list of protein structures is needed as input. It is entered in the "Structure list" text field. The Structure list contains on each line a PDB code, an optional PDB chain identifier, and an optional user-defined family name. These fields are separated by spaces (for example "1GZ8 A inactive"). Autodetection of the first chain and of all chains of a PDB file is possible with 'first' (default) and '*', respectively. A blank chain identifier is entered as '_'. If the basename has the format of a PDB code, attempt is made to download the file from the PDB server. It is also possible to upload custom PDB files or ZIP of PDB files. Only standard PDB ATOM records are treated by PSSweb. When an atom has alternate locations, only the first one is considered. Only the first model of NMR PDB files is read.
Position list
A list of positions can also be provided as input. It is entered in the "Position list" text field. The Position list is used to restrict the list of amino acid positions and structural variables of interest for certain analyses. The format of this list is two columns separated by spaces.
The first column determines which positions are included in the cluster analysis and in dihedral distribution plots. The second column contains definitions of dihedral angles to be included in clustering at the positions specified in the first column.
The format of the first column consists in position ranges. Ranges can be a single position ("159"), a range of positions ("144:158"), or all positions ("all"). The reference for position numbering is the multiple sequence alignment.
The format of the second column consists in a list of dihedral angles. Allowed values are "B" for backbone (φ and ψ), "S" for sidechain (all χ angles), "A" for all (all angles including ω), or a comma-separated list (no space) of angles among "phi", "psi", "omega", "chi1", "chi2", "chi3", or "chi4". The second column is optional (default is "B").
Multiple sequence alignment
Obtaining a multiple alignment of input protein sequences is an essential preliminary step in the PSSweb workflow. PSSweb is indeed meant to analyze ensembles of proteins with similar but different sequences, and it is necessary to establish a correspondence between amino acid positions of the different sequences before structural comparisons can be performed.
We propose four different approaches to multiple sequence alignment: PDB numbering, sequence alignment with Clustal Omega, sequence alignment with MODELLER, and sequence/structure alignment with MODELLER.
- PDB numbering
-
The first and simplest method consists in deriving the multiple sequence alignment simply from PDB numbering. It is assumed in this case that residues in the ensemble of PDB structures are numbered in a consistent way, and the sequence alignment is straightforwardly determined by residue numbers. It is the method of choice for ensembles of structures corresponding to the same sequence with only small variations like different extremities, point mutations or engineered positions.
- Sequence alignment with Clustal Omega
-
The second method uses Clustal Omega, a fast and scalable general multiple sequence alignment program. Default options are employed.
- Sequence alignment with MODELLER
-
The third method obtains a multiple sequence alignment with the SALIGN module of MODELLER, using only sequence information (feature 1 of SALIGN). Local alignments are performed, using the "tree" alignment method, a BLOSUM type similarity matrix, affine 1D gap penalties of -450 for opening and -50 for extension, and a maximum of 30 overhanging residues at the sequence termini not penalized for gaps if not aligned.
- Sequence/structure alignment with MODELLER
-
The fourth method obtains a multiple sequence/structure alignment with the SALIGN module of MODELLER, using sequence and structure informations. Three successive cycles are performed with respective values for feature_weights of (1,0,0,0,1,0), (1,0.5,1,1,1,0), and (1,1,1,1,1,0). The same options as in the sequence alignment method are used. When feature 2 is included, affine 3D gap penalties of 0 for opening and 3 for extension are used.
An additional possibility proposed is to upload a custom multiple sequence alignment.
The first alignment position is set to 1 by default but this can be changed with the "First alignment position" input box.
Consensus sequence
A consensus sequence is determined from the multiple sequence alignment. A consensus residue is defined as the most frequent residue type (gaps excepted) at a particular position in the multiple alignment. The consensus sequence is used to define a reference amino acid type in structural statistics involving sidechains.
Superposition of structures
If the "Superposition of structures" checkbox is selected, superposition of structures on the reference structure defined in the "reference structure" input field (for example "1GZ8:A") is performed. If a reference structure is not provided, the first structure is used. Two methods are proposed.
- Superposition with Theseus
-
Theseus uses a maximum likelihood approach for structure superposition. Default options are employed.
- Superposition with MODELLER
-
MODELLER uses an iterative least-square minimization algorithm for structure superposition. The
selection.superpose()method is used. Residues that have a RMSD greater than 1.0 Å with respect to the reference are excluded of the selection in the next iteration, until there is no change in the number of equivalent positions.
Cartesian analysis
If the "Cartesian analysis" checkbox is selected, structural statistics are computed from Cartesian coordinates. It is assumed that structures have previously been superposed, with the "Superposition of structures" option.
For each position of the sequence alignment, atomic coordinates and B-factors are read from the ensemble of structures. Averages and standard deviations of coordinates, as well as average B-factors are then calculated and averaged separately over backbone and sidechain atoms. Only sidechains of the same type as the consensus residue at a given position are taken into account.
Dihedral analysis
If the "Dihedral analysis" checkbox is selected, structural statistics are computed from dihedral angles of original structures. Superposition is indeed not necessary to compare internal coordinates.
For each position of the sequence alignment, dihedral angles (φ, ψ, ω, χ1, χ2, χ3, and χ4) are calculated. Dihedral angle definitions follow IUPAC recommendations. A symmetrization of sidechain dihedral χ2 for residues Asp, Phe, Tyr, and of χ3 for Glu, is done to ensure that chemically equivalent conformations (for example a switch between Oδ1 and Oδ2 atoms in Asp) are seen as identical.
Dihedral angle statistics are then calculated, including circular averages and standard deviations for φ, ψ, ω, and χs angles. Sidechain dihedral angles are not taken into account in statistics if they belong to a residue of a different type as the consensus residue. If multiple families have been defined, statistics are also calculated for each of them separately.
Clustering
If the "Clustering" checkbox is selected, the structures are subjected to a cluster analysis, based on the Algorithm::Cluster Perl module, an interface to the C Clustering Library.
Structural variables taken into account in clustering can be controlled with the Position list (format is explained above). The first column of this file is used to select alignment positions and the second column defines dihedral angles taken into account at these positions.
Pairwise circular distances are computed from selected dihedral angles at each position. A global distance matrix is then calculated as the square root of the sum of squared circular distances divided by the number of selected angles. Sidechain dihedral angles are not taken into account in the distance matrix if they belong to a residue of a different type as the consensus residue.
Hierarchical clustering is then performed with the
treecluster() method of Algorithm::Cluster. A tree
is calculated from the distance matrix and the clusters are
obtained by cutting the tree with the cut() method of
Algorithm::Cluster::Tree, according to the chosen "cluster radius"
option (default is 60 degrees). The radius parameter corresponds to the
minimum inter-cluster distance allowed.
In some situations, the number of structures included is zero and the clustering cannot be performed. It means that some of the requested structural variables were defined in none of the structures. The recommended procedure is then to find the structural variables responsible for the exclusion of structures, remove them from the Position list, and run again the cluster analysis.
Submission
Once the form has been completed, the calculations are launched with the "Submit" button. Next to the "Submit" button, there is a "Reset" button to clear the form, and a "Load example" button to fill the form with an example.
The calculation progress can be followed in three text fields below the buttons. The first is the status field, printing "CALCULATION RUNNING" during the calculation and "CALCULATION FINISHED" at the end of it, as well as a time counter in seconds. The second is the report field, printing the URL of the HTML report created for the project, as well as the URL of a ZIP file of the report directory for download. The last is the log field, printing the output of the PSS program while it runs.
Results page
An HTML report containing a summary of the results with figures and tables is created. The URL of the results page is given to the user at the moment of the form submission (for example "http://pssweb.org/projects/183291").
A reminder of the arguments passed to PSS is first provided, followed by a link to the command file, containing the full command line executed. The different sections of the HTML report are folded by default. The sections can be unfolded/folded individually or all at once by clicking on the unfold all/fold all links.
A table of the structures studied with chains and optional family names is then included. Then the multiple alignment along with the consensus sequence are displayed, and links to align.fasta, consensus.fasta, composition.dat, and positions.dat files are provided.
If superposition of structures has been performed, direct links to superposed PDB files are provided, as well as links to PyMOL and VMD scripts to load superposed structures at once with these programs.
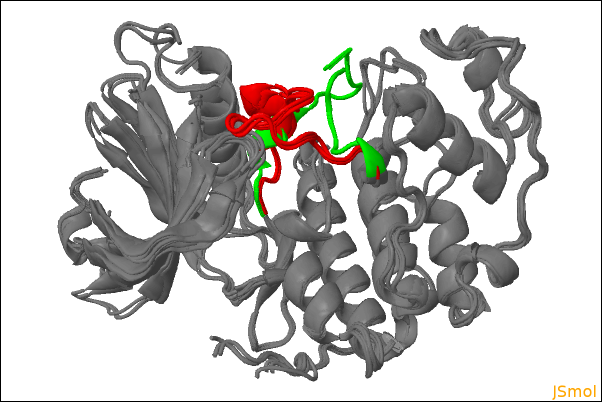
If 3D visualization of superposed structures was requested, a JSmol viewer is included in the HTML report. This allows an interactive 3D visualization of the superposed structures. The rendering style and color mode can be modified and the individual structures can be displayed or hidden with checkboxes. Note that JSmol is not equally well supported by all browsers. Google Chrome and Firefox are known to work best. An alternative for large ensembles or large structures is to download the ZIP file of the report and visualize the superposed structures offline with the PyMOL or VMD scripts provided.
| 3D visualization of superposed structures: |
 |
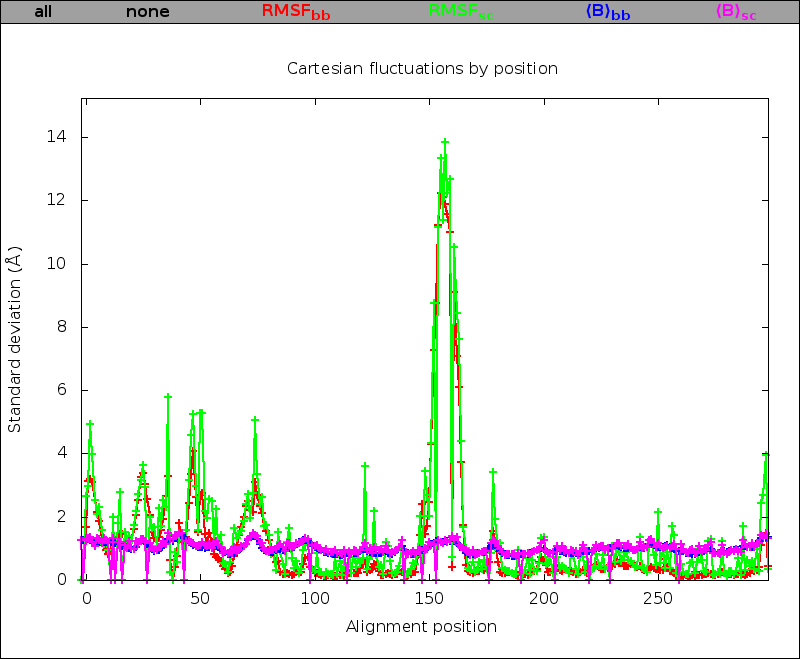
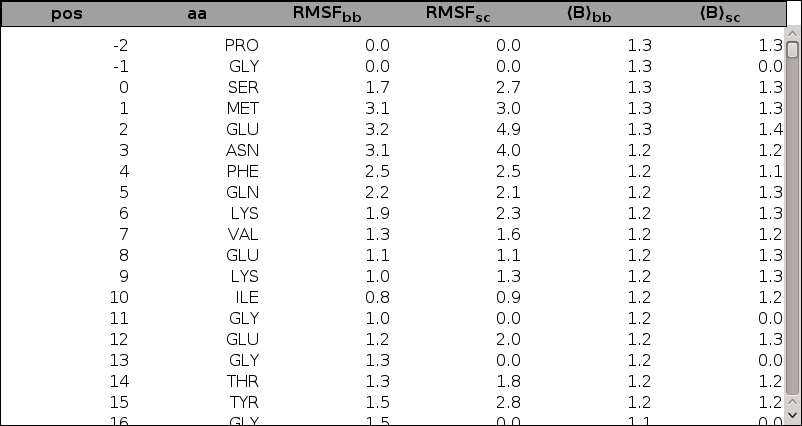
If the Cartesian analysis has been performed, plots of root mean square fluctuations of Cartesian coordinates and average B-factors, for backbone or sidechain atoms, as a function of the alignment position are included. These plots are superposable to ease comparison, each plot can be hidden/displayed by clicking on the corresponding link above the plotting area. In addition, a sortable and scrollable table containing the data is provided below the plots. Sorting is obtained by clicking on column headers. Note that basic combined sorting is possible, for example a sort by amino acid type following a sort by RMSF will preserve the RMSF order for each amino acid type. Reinitialization is obtained by a position sort. Links to the raw data cartstat.dat file and to the average structure average.pdb file are also provided.
| Cartesian fluctuation superposable figure: | Cartesian fluctuation sortable and scrollable table: |
 |
 |
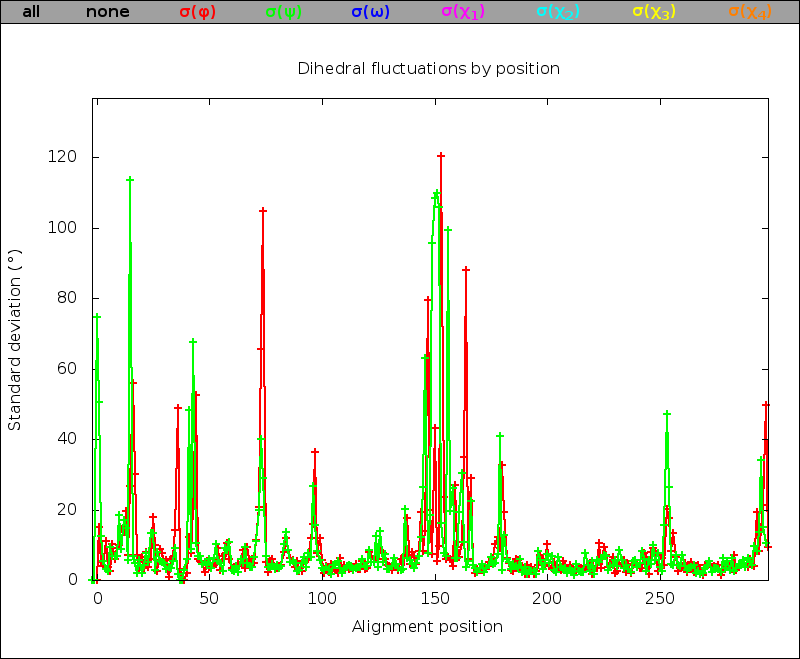
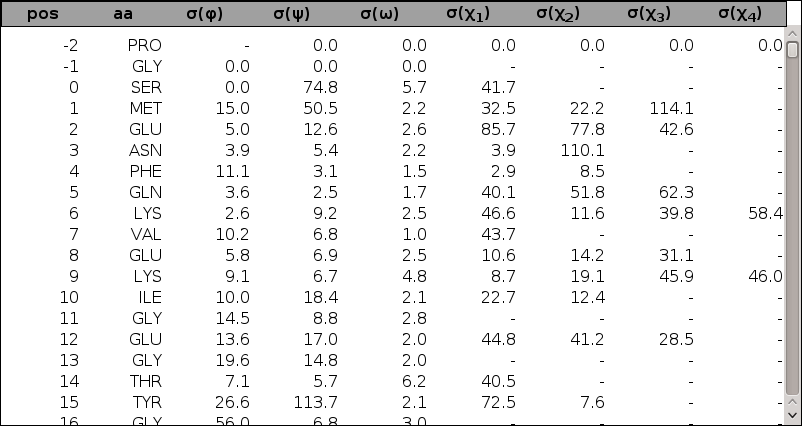
If the dihedrals analysis has been performed, plots of φ, ψ, ω, χ1, χ2, χ3, and χ4 dihedral angle standard deviations as a function of the alignment position are included. As for the Cartesian analysis, plots are superposable, tables are sortable and scrollable, and a link to the raw data dihestat.dat file is provided.
| Dihedral fluctuation superposable figure: | Dihedral fluctuation sortable and scrollable table: |
 |
 |
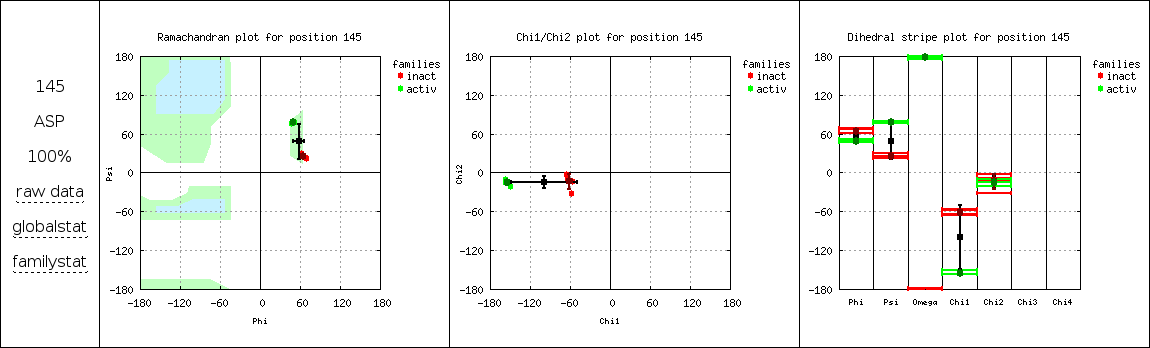
Additionally, Ramachandran (φ/ψ), χ1/χ2, and individual dihedral angle distributions are plotted for each alignment position defined in the Position list. If different families were defined in the Structure list, different colors are used to distinguish points belonging to each family. On the left of plots, the "raw data" link gives access to the data files, the "globalstat" link allows the visualization of dihedral angle circular averages and standard deviations on top of the distributions, and the "familystat" link does the same for circular averages and standard deviations by family. Sidechain dihedral angles are not represented in distribution plots if they belong to a residue of a different type as the consensus residue. Note that displaying the distribution plots of many positions can produce a heavy HTML page.
| Dihedral distribution figures: |
 |
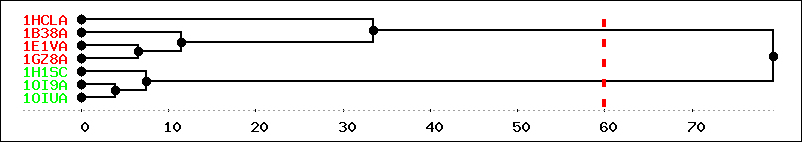
If clustering has been performed, a reminder of dihedral angle variables taken into account is first presented in a table. The clustering results are then presented in a table of cluster members sorted by cluster number. Then a link to structlist.dat, a Structure list file with cluster numbers in the family column, is provided to facilitate the setup of another run of PSS with a definition of families corresponding to identified clusters. At last, a dendrogram plot is included to visualize the clustering tree obtained, with the chosen cutting radius as a vertical line.
| Clustering dendrogram: |
 |
Testcase
A testcase can be easily loaded in the input form by clicking on the "Load example" button. The testcase results page is available at [examples/testcase/index.html].
This is a description of the testcase:
-
7 CDK2 (cyclin dependant kinase 2) structures are selected in the Structure list, and classified into two families, inactive or active
-
The multiple sequence alignment is derived from PDB numbering
-
The structures are superposed on the A chain of the 1GZ8 structure
-
Structural statistics in Cartesian coordinates are calculated
-
Structural statistics in dihedral coordinates are calculated
-
A cluster analysis is performed based on positions and dihedrals defined in the Position list
-
3D visualization of superposed structures is provided
